

Interactive igraph networks in R, Quarto and Shiny
Start with an igraph object:
library(garphieldr)library(igraph)
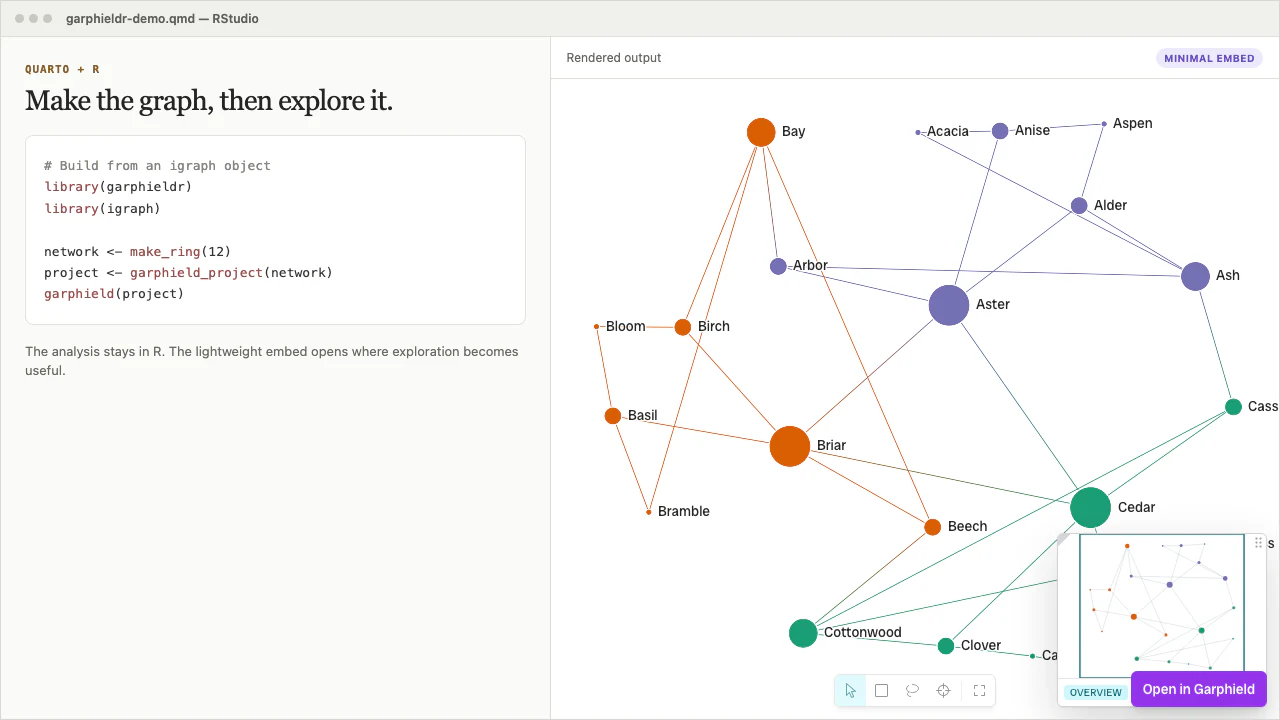
network <- make_ring(12)project <- garphield_project(network)garphield(project)
garphield_project() creates a .gph project. garphield() displays its graph
and saved view in an htmlwidget.
Save the project
Section titled “Save the project”write_gph(project, "network.gph")
restored <- read_gph("network.gph")garphield(restored)The file carries the graph and its visual workspace. The browser workbench and Python package open the same document.
Start from tables
Section titled “Start from tables”nodes <- data.frame( id = c("Ada", "Grace", "Edsger", "Barbara"), group = c("language", "language", "algorithms", "systems"))
edges <- data.frame( source = c("Ada", "Grace", "Edsger", "Barbara"), target = c("Grace", "Edsger", "Barbara", "Ada"), relation = c("influenced", "influenced", "worked with", "influenced"))
project <- garphield_project(nodes = nodes, edges = edges)garphield(project)source, target, and id define the topology. Other columns remain
available as node and edge attributes.
Put it in Quarto
Section titled “Put it in Quarto”Use the same call inside a code chunk:
```{r}library(garphieldr)library(igraph)
project <- garphield_project(make_ring(12))garphield(project)```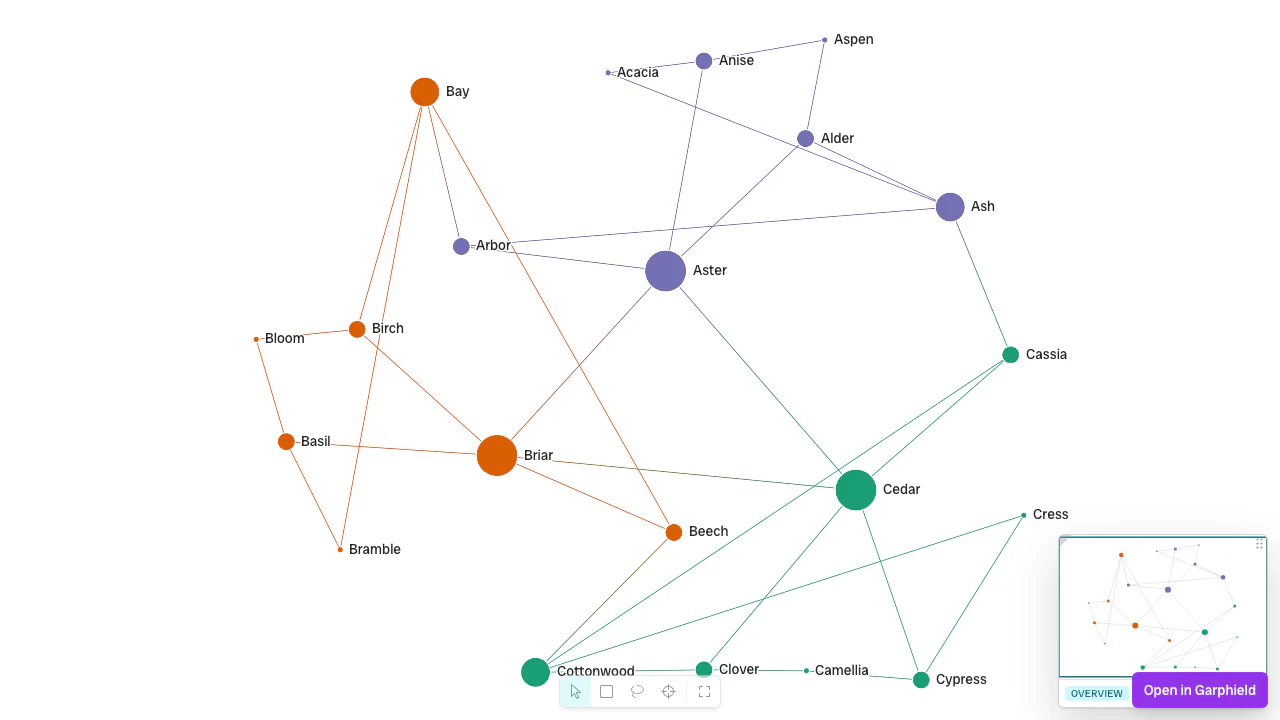
Update it from Shiny
Section titled “Update it from Shiny”Render once, then use a proxy for later changes:
server <- function(input, output, session) {  project <- garphield_project(make_ring(12))  output$network <- renderGarphield(project)  output$clicked <- renderPrint(input$network_node_click)
  observeEvent(input$theme, {    garphieldProxyRun(      garphieldProxy("network", session),      "setTheme",      list(colorScheme = input$theme)    )  })}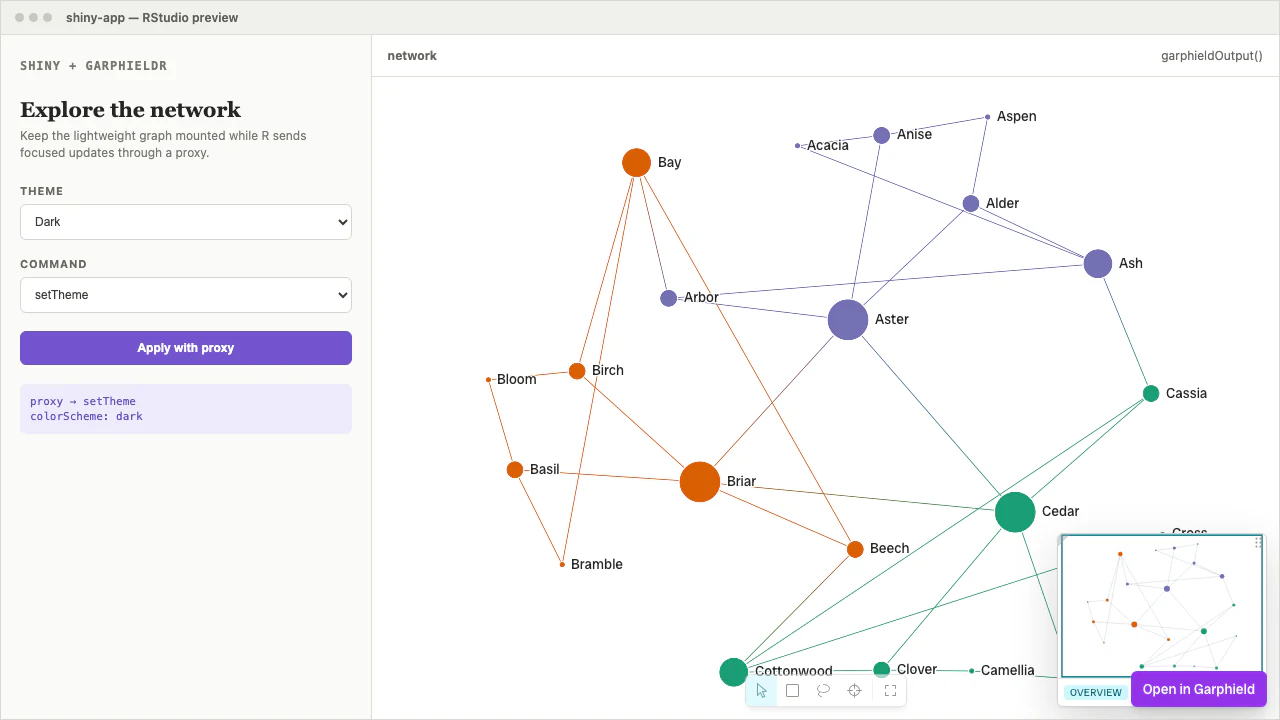
Continue with the R overview, RStudio and Quarto, or Shiny guide.